ATR Candle Breakout EA: an AI-built Gold strategy, verified live
A momentum breakout EA for MetaTrader 5, built with Claude AI and verified by me on a live account. 11-year XAUUSD backtest on real tick data plus a test-vs-live comparison.
By René Balke
Most “AI trading bot” posts are pure hype. This one is different. I’ll show you a momentum breakout EA for MetaTrader 5 that was built with Claude AI, verified line by line by me as a professional MQL5 developer, backtested across 11 years of real Gold tick data — and, most importantly, running on my live account since March 2026.
The part that matters most comes at the end: a direct test-vs-live comparison. For breakout strategies that’s the make-or-break test, and it’s exactly where most of them fall apart. The ATR Candle Breakout EA holds up — here’s the full picture, the good and the honest.
What you’ll learn
- How the ATR Candle Breakout strategy actually works — in more detail than the product page
- What an 11-year backtest on 100% real tick data looks like
- Why test-vs-live matters more for breakout strategies than any other number
- How to get the EA for free
The strategy: trading volatility expansion
Most candles are noise. Every now and then, one candle is dramatically larger than the recent average — a sudden burst of momentum where buyers or sellers take control. That expansion is what the ATR Candle Breakout EA hunts for.
It works in three steps:
- Measure the noise. The EA calculates the Average True Range (ATR) — the average size of recent candles — on your chosen timeframe. The ATR is its definition of “normal.”
- Wait for an outlier. On each closed candle, it compares the candle’s size to the ATR. Only when a candle is significantly larger than that average — a genuine volatility expansion — does it qualify as a breakout signal.
- Confirm the conviction. A big candle isn’t enough on its own. The candle also has to close near its own extreme — near its high for a buy, near its low for a sell. That tells you the move held into the close rather than fading. The EA then trades in the direction of that breakout.
On top of that core logic you get a full toolkit of optional filters: a higher-timeframe trend filter, a multi-timeframe ATR confirmation, a time-of-day window, and a support/resistance filter that stops you from buying straight into a wall of resistance. Position size is calculated automatically from a fixed money risk and the stop distance, so every trade risks the same amount regardless of how wide the stop is.
It’s a low-win-rate, high-reward strategy by design — you take a lot of small losses and let a handful of large momentum runs pay for them. If a 23% win rate makes you nervous, this isn’t the strategy for you. If you understand asymmetric risk/reward, read on.
Built with AI, verified by a human
Here’s the part I won’t hide: this EA was built with Claude AI.
That sentence makes a lot of traders nervous, and they’re right to be skeptical — the internet is full of “AI-generated” EAs written by people who can’t read a line of MQL5 and have no idea whether the code does what they think it does. That’s genuinely dangerous when real money is on the line.
This is the opposite. I’m a professional MQL5 developer — I’ve coded 200+ bots and I teach EA programming in my MT5 Masterclass. I used Claude as a fast, capable pair-programmer, then read, tested and verified every part of the logic myself: the ATR calculation, the lot-sizing math, the filter conditions, the trailing-stop handling. Nothing went live until I understood exactly what it does.
So the honest framing is: AI-built, human-verified, and live-traded for months. AI made me faster. It didn’t make the decisions.
11 years on Gold, 100% real tick data
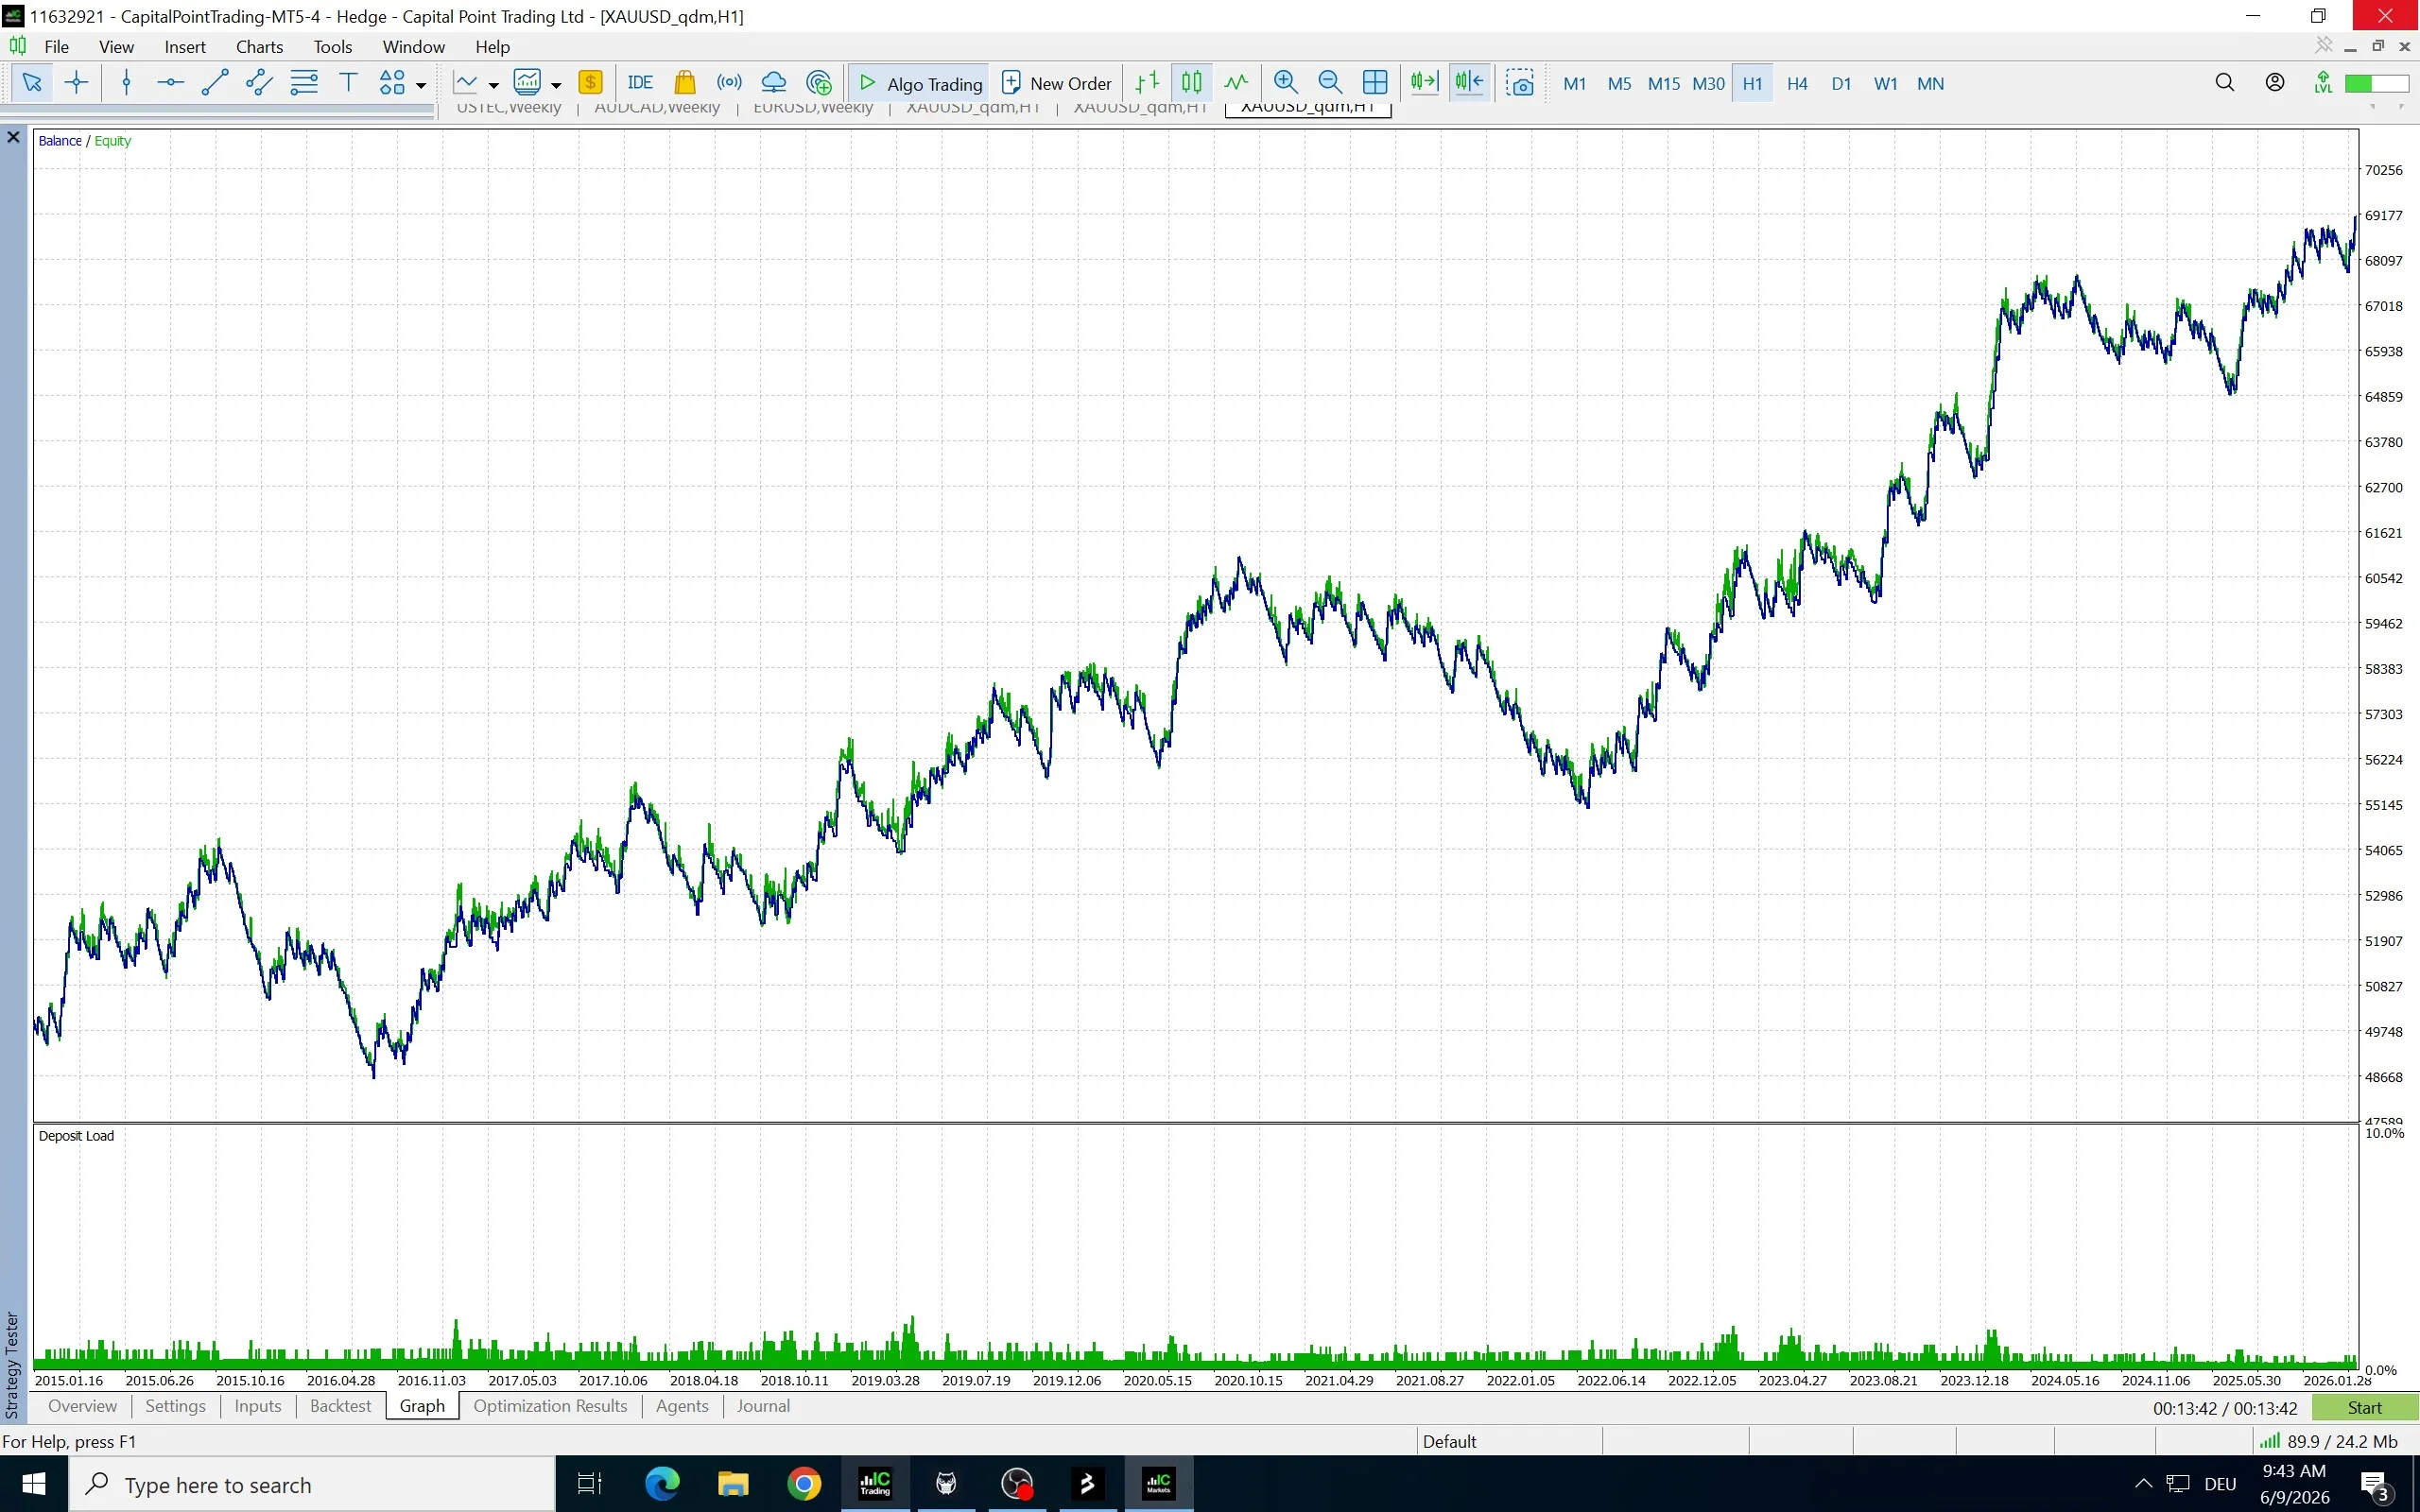
I backtested the strategy on XAUUSD (Gold) from 2015 to 2026 using Dukascopy 100% real tick data — over 561 million ticks, history quality 100%. Real tick data matters enormously for a breakout strategy: cheap “1-minute OHLC” backtests hide the spread and slippage that hit you exactly when a big candle fires. If you’re going to trust a backtest, it has to be modelled on real ticks.
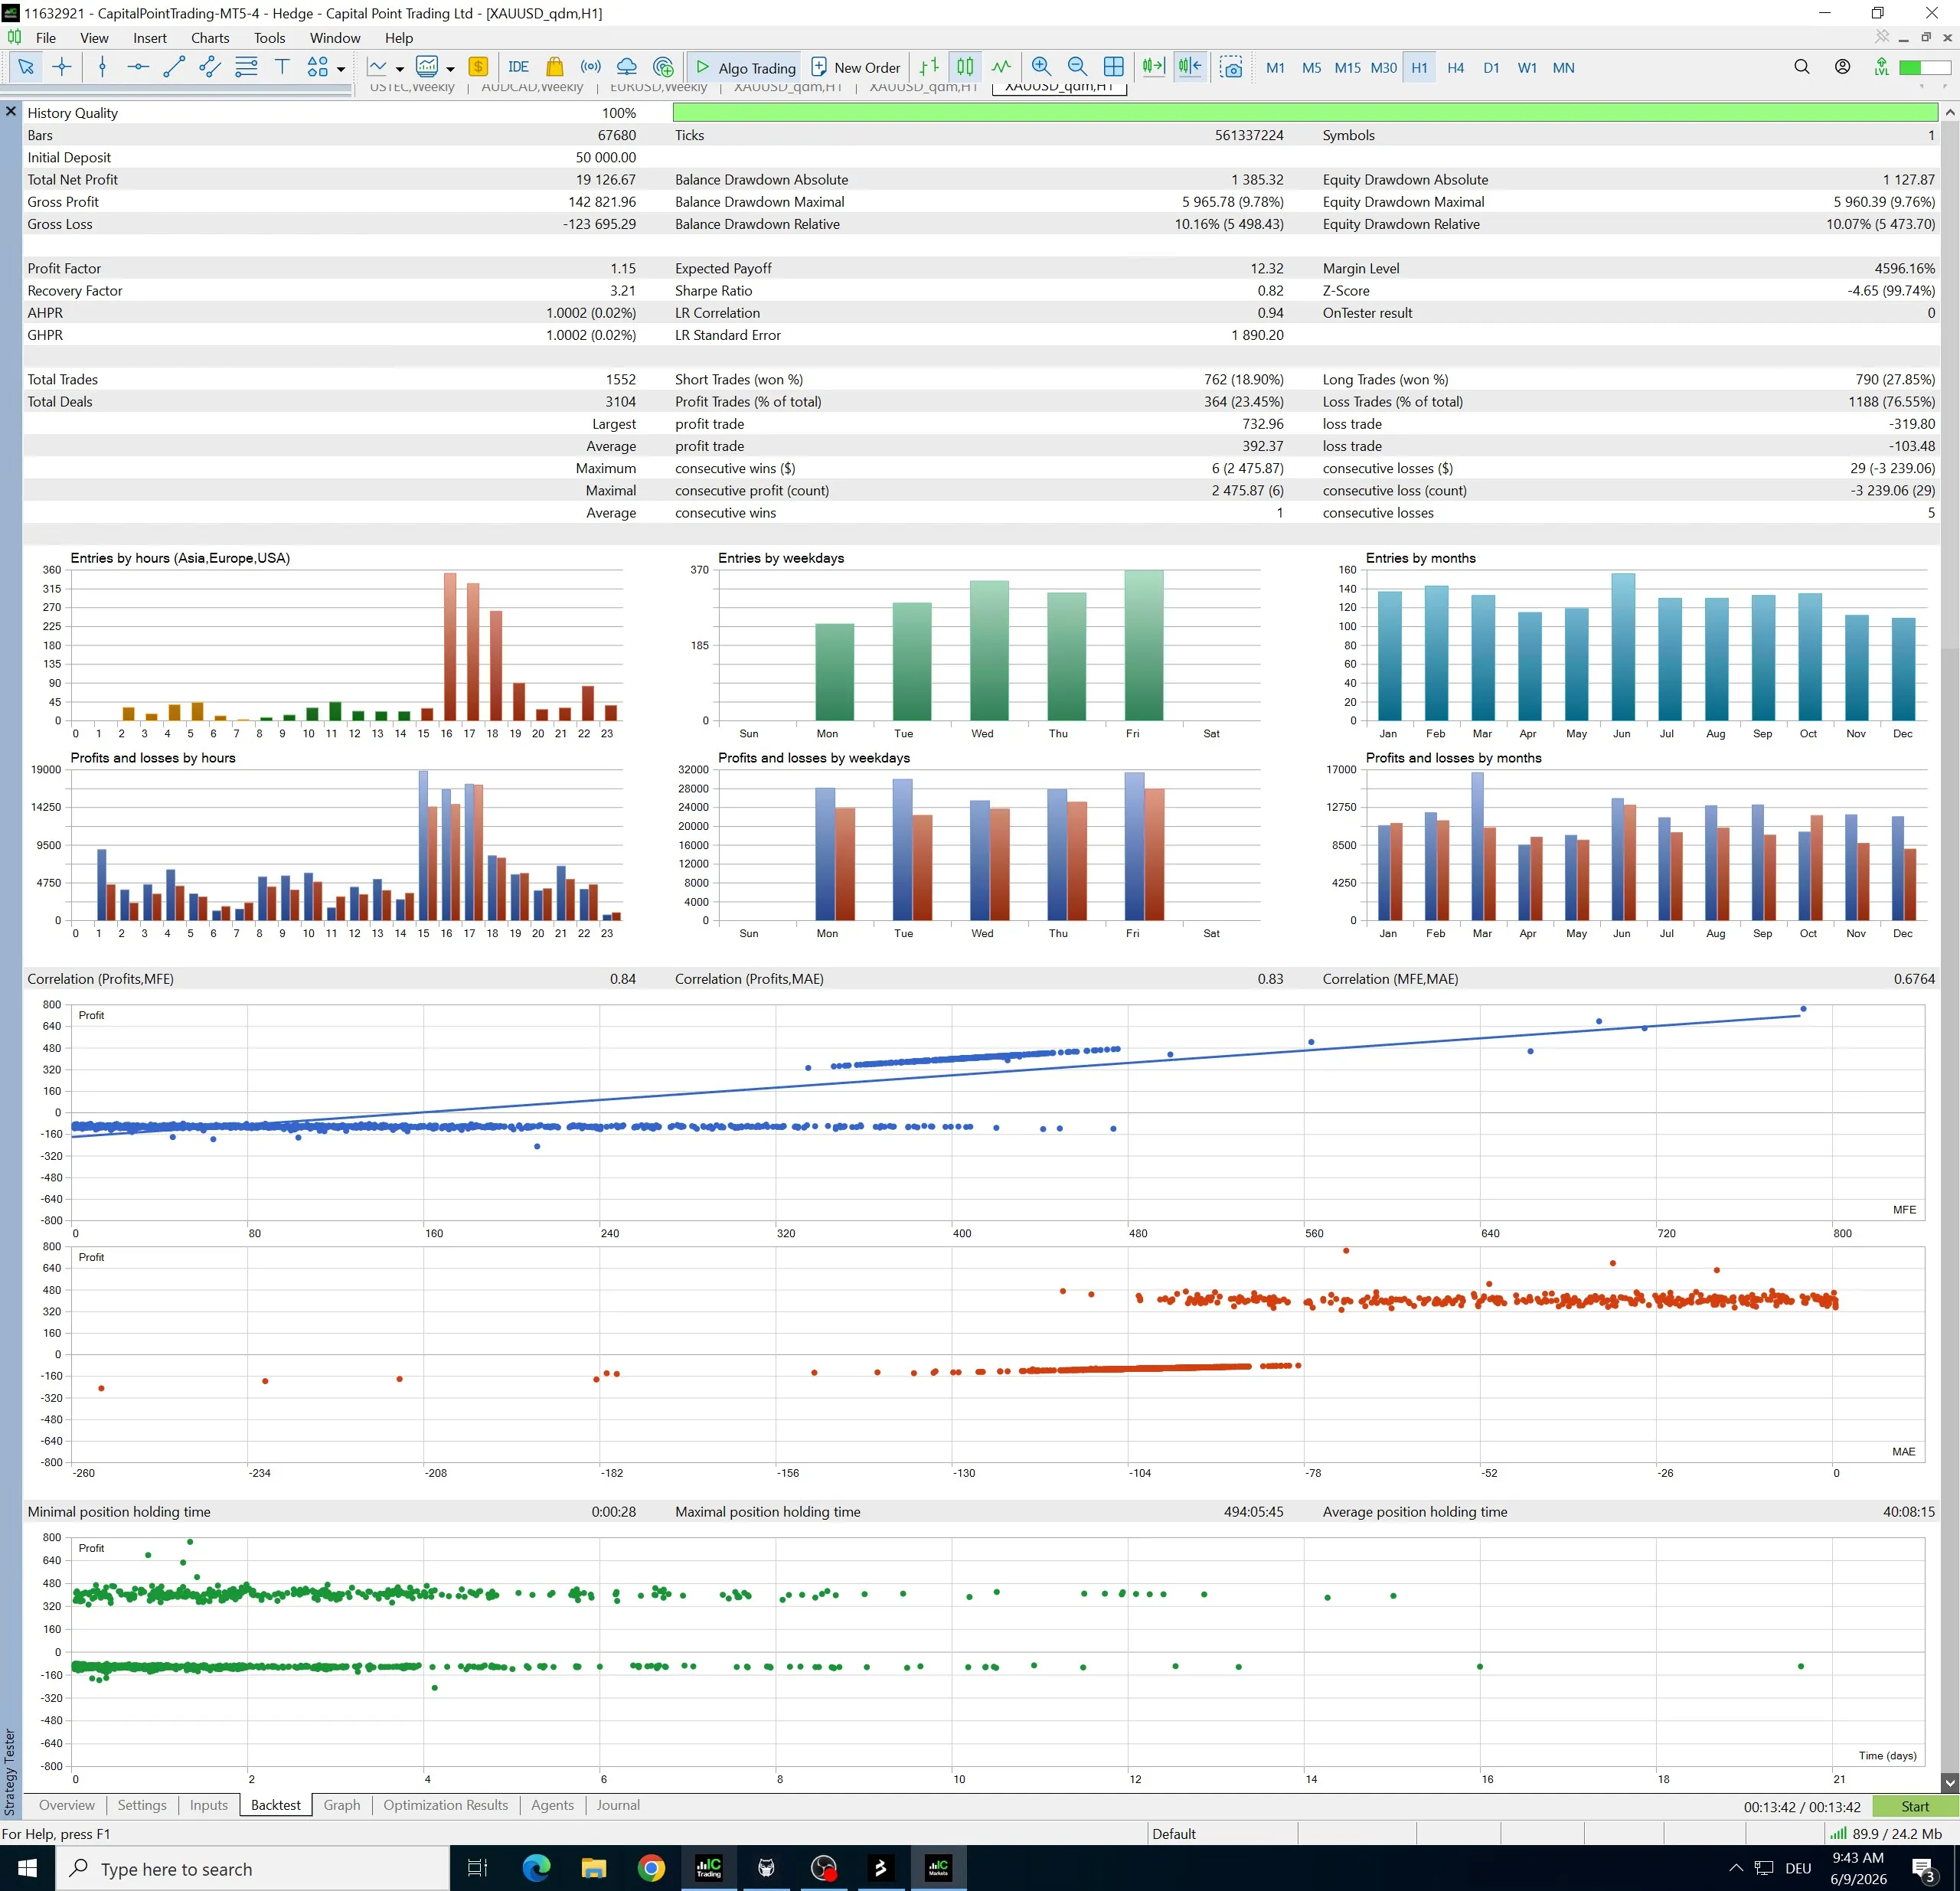
Let me be straight about what this is and isn’t. A profit factor of 1.15 and a ~23% win rate are not “holy grail” numbers, and I’d be lying if I dressed them up. What they represent is a robust, slow-grinding edge that survived 11 years — including 2015’s chop, the COVID crash, and the wild Gold moves of the last two years — while keeping the maximum drawdown around 10%. The equity curve above climbs steadily with the periodic drawdowns you’d expect from a breakout system. No curve-fit miracle, just a real edge with honest variance.
The test that actually matters: live vs backtest
A backtest is a hypothesis. The real question for a breakout strategy is: does it still work when you’re entering fast-moving markets with real spread and slippage? Big momentum candles are precisely the moments when execution gets expensive — so a strategy that looks great in the tester can bleed out live.
I’ve been running the ATR Candle Breakout EA live on Gold since March 2026. Here’s the comparison between the backtest and my actual live fills over the same window, pulled straight from my Trade Buddy journal:
| Metric | Backtest | Live | Difference |
|---|---|---|---|
| Trades | 23 | 24 | +1 |
| Win rate | 26.1% | 25.0% | −1.1 pp |
| Net P&L | +€634.03 | +€515.65 | −€118.38 |
| Profit factor | 1.40 | 1.30 | −0.09 |
| Max drawdown | €1,028 | €1,139 | +€111 |
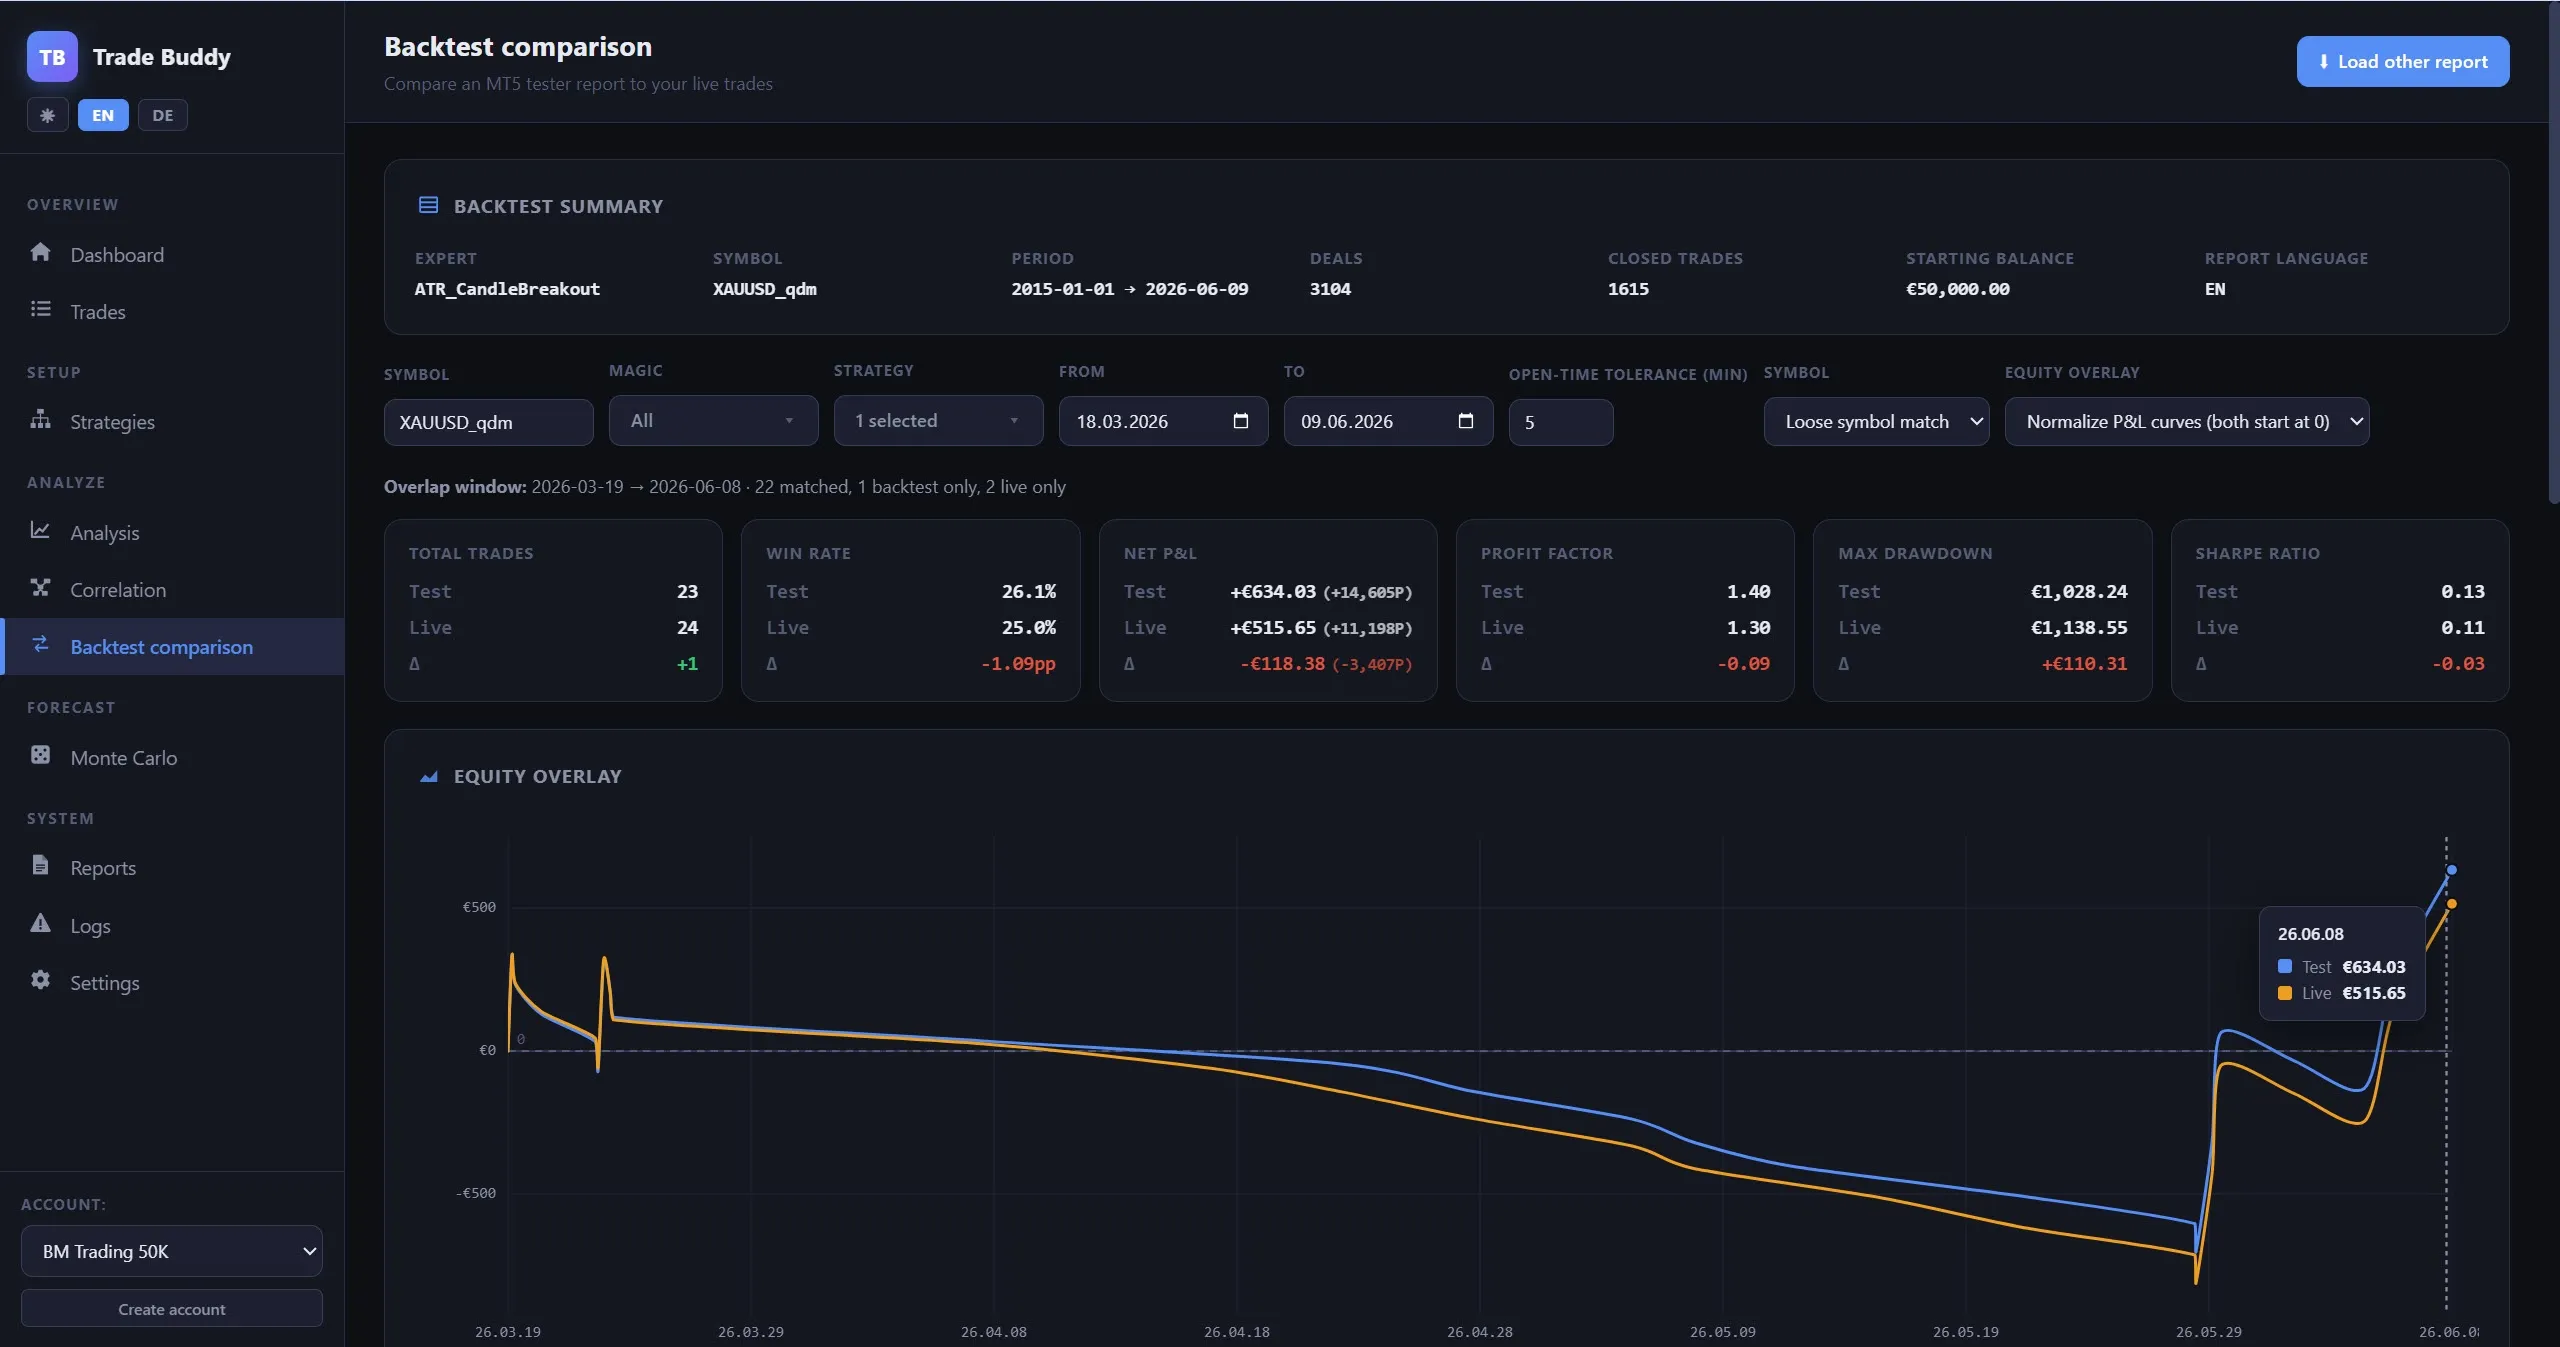
This is exactly the result you want to see. 24 live trades, +€515.65 in real profit, and the live curve tracks the backtest closely. Live came in about €118 below the test — partly from slippage, and partly because the live account took one trade more than the test, so the two samples aren’t perfectly identical. What matters is that the strategy didn’t fall apart: almost exactly the same trades, near-identical win rate, profit factor still comfortably above 1. For a breakout strategy, a live result that mirrors the backtest this closely is the strongest validation there is.
The honest take
This is not a get-rich-quick machine, and I won’t pretend otherwise:
- The win rate is low — expect long stretches of small losses between the winners. You need the temperament to sit through that.
- Breakout strategies struggle in quiet, range-bound markets and shine when volatility expands. There will be flat or losing months.
- Eleven profitable years and a clean live quarter are not a guarantee of future profit. Nobody can promise that — me included.
What I can tell you is that I trade it with my own money, the logic is sound, and the live results match the test. That’s as honest as it gets in this space.
Get the ATR Candle Breakout EA for free
The EA is completely free. Download it, run unlimited backtests in the MT5 Strategy Tester on your own data, and decide for yourself.
To run it live, open an account with one of my partner brokers and request a free license via the license form. And if you want to verify your own backtest against your live fills the way I did above, that’s exactly what Trade Buddy is for — also free, no signup.
Good luck — and good trades.
The Expert Advisor that matches this post
ATR Candle Breakout EA
Catches unusually large momentum candles — breakouts measured against the ATR.
View EA →
Risk note: nothing in this post is investment advice. Trading forex and CFDs carries significant risk. Past performance is no guarantee of future results.