July 2026: Back in the Green — Thanks to the Exact Currency That Ruined June
July closed at +€1,526 — a modest number with big stories inside: USDJPY, June's problem child, delivered +€5,228 including my biggest trade ever. The honest, verified breakdown.
By René Balke
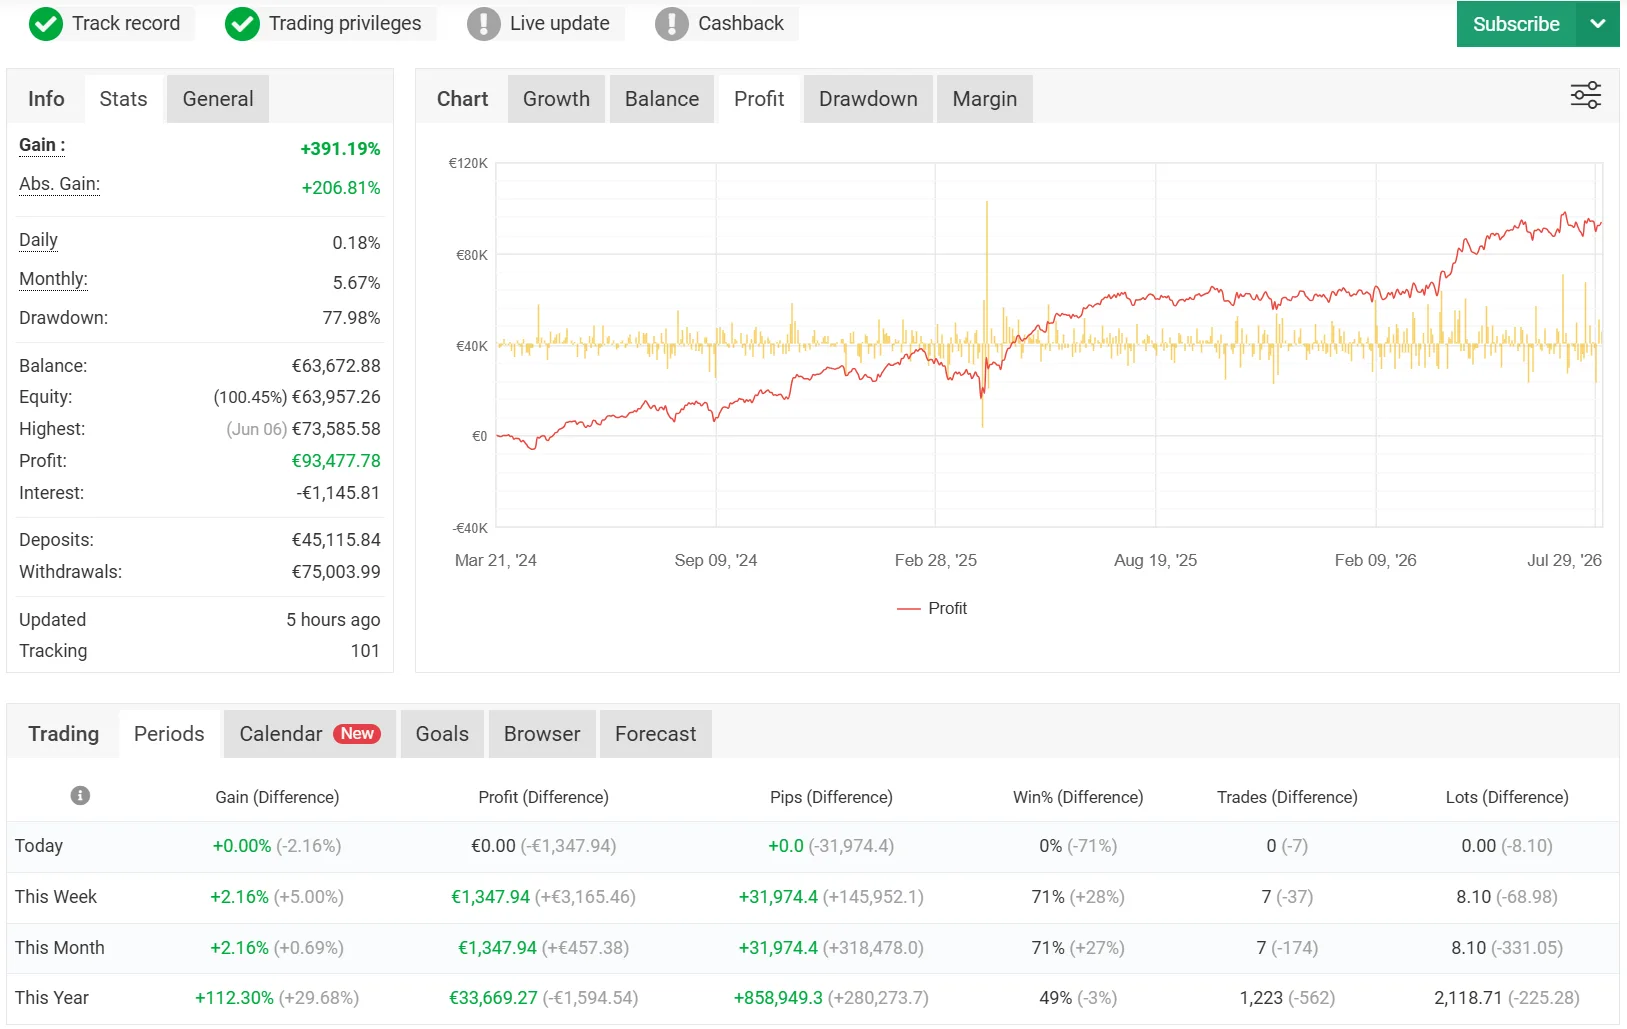
Last month I showed you a rare red month — −€477, caused almost entirely by USDJPY. July closed back in the green at +€1,526. And here’s the part I genuinely enjoy: the single biggest contributor was USDJPY, at +€5,228 — the exact currency that ruined June. Full circle, in one month.
The headline number is modest. The stories inside it are not: my biggest trade ever, a comeback attempt in GBPUSD, an index pullback that cost real money, and a portfolio that’s now within sight of €100,000 verified profit.
The video walkthrough
The full month, strategy by strategy:
What happened this month
First things first: nothing changed in the setup. Same charts, same strategies, same risk — three Go Long charts, Range Breakout on USDJPY, GBPUSD, gold, EURJPY, DE40 and US30, Turnaround Tuesday on USTEC, US30 and DE40, and the experimental ATR Candle Breakout on gold.
The indices split up this month: DE40 printed fresh all-time highs, US30 is effectively at its highs — but USTEC pulled back to roughly 5–7% below its peak. After surging about 30% in just a few months, a retracement like that is textbook stock-market behaviour.
And don’t let the quiet +€1,526 fool you: this was a volatile month. 189 trades, 45% win rate, profit factor 1.04 — and an intra-month drawdown of €10,742 on the way to that small green number. That’s what a “flat” month actually looks like from the inside.
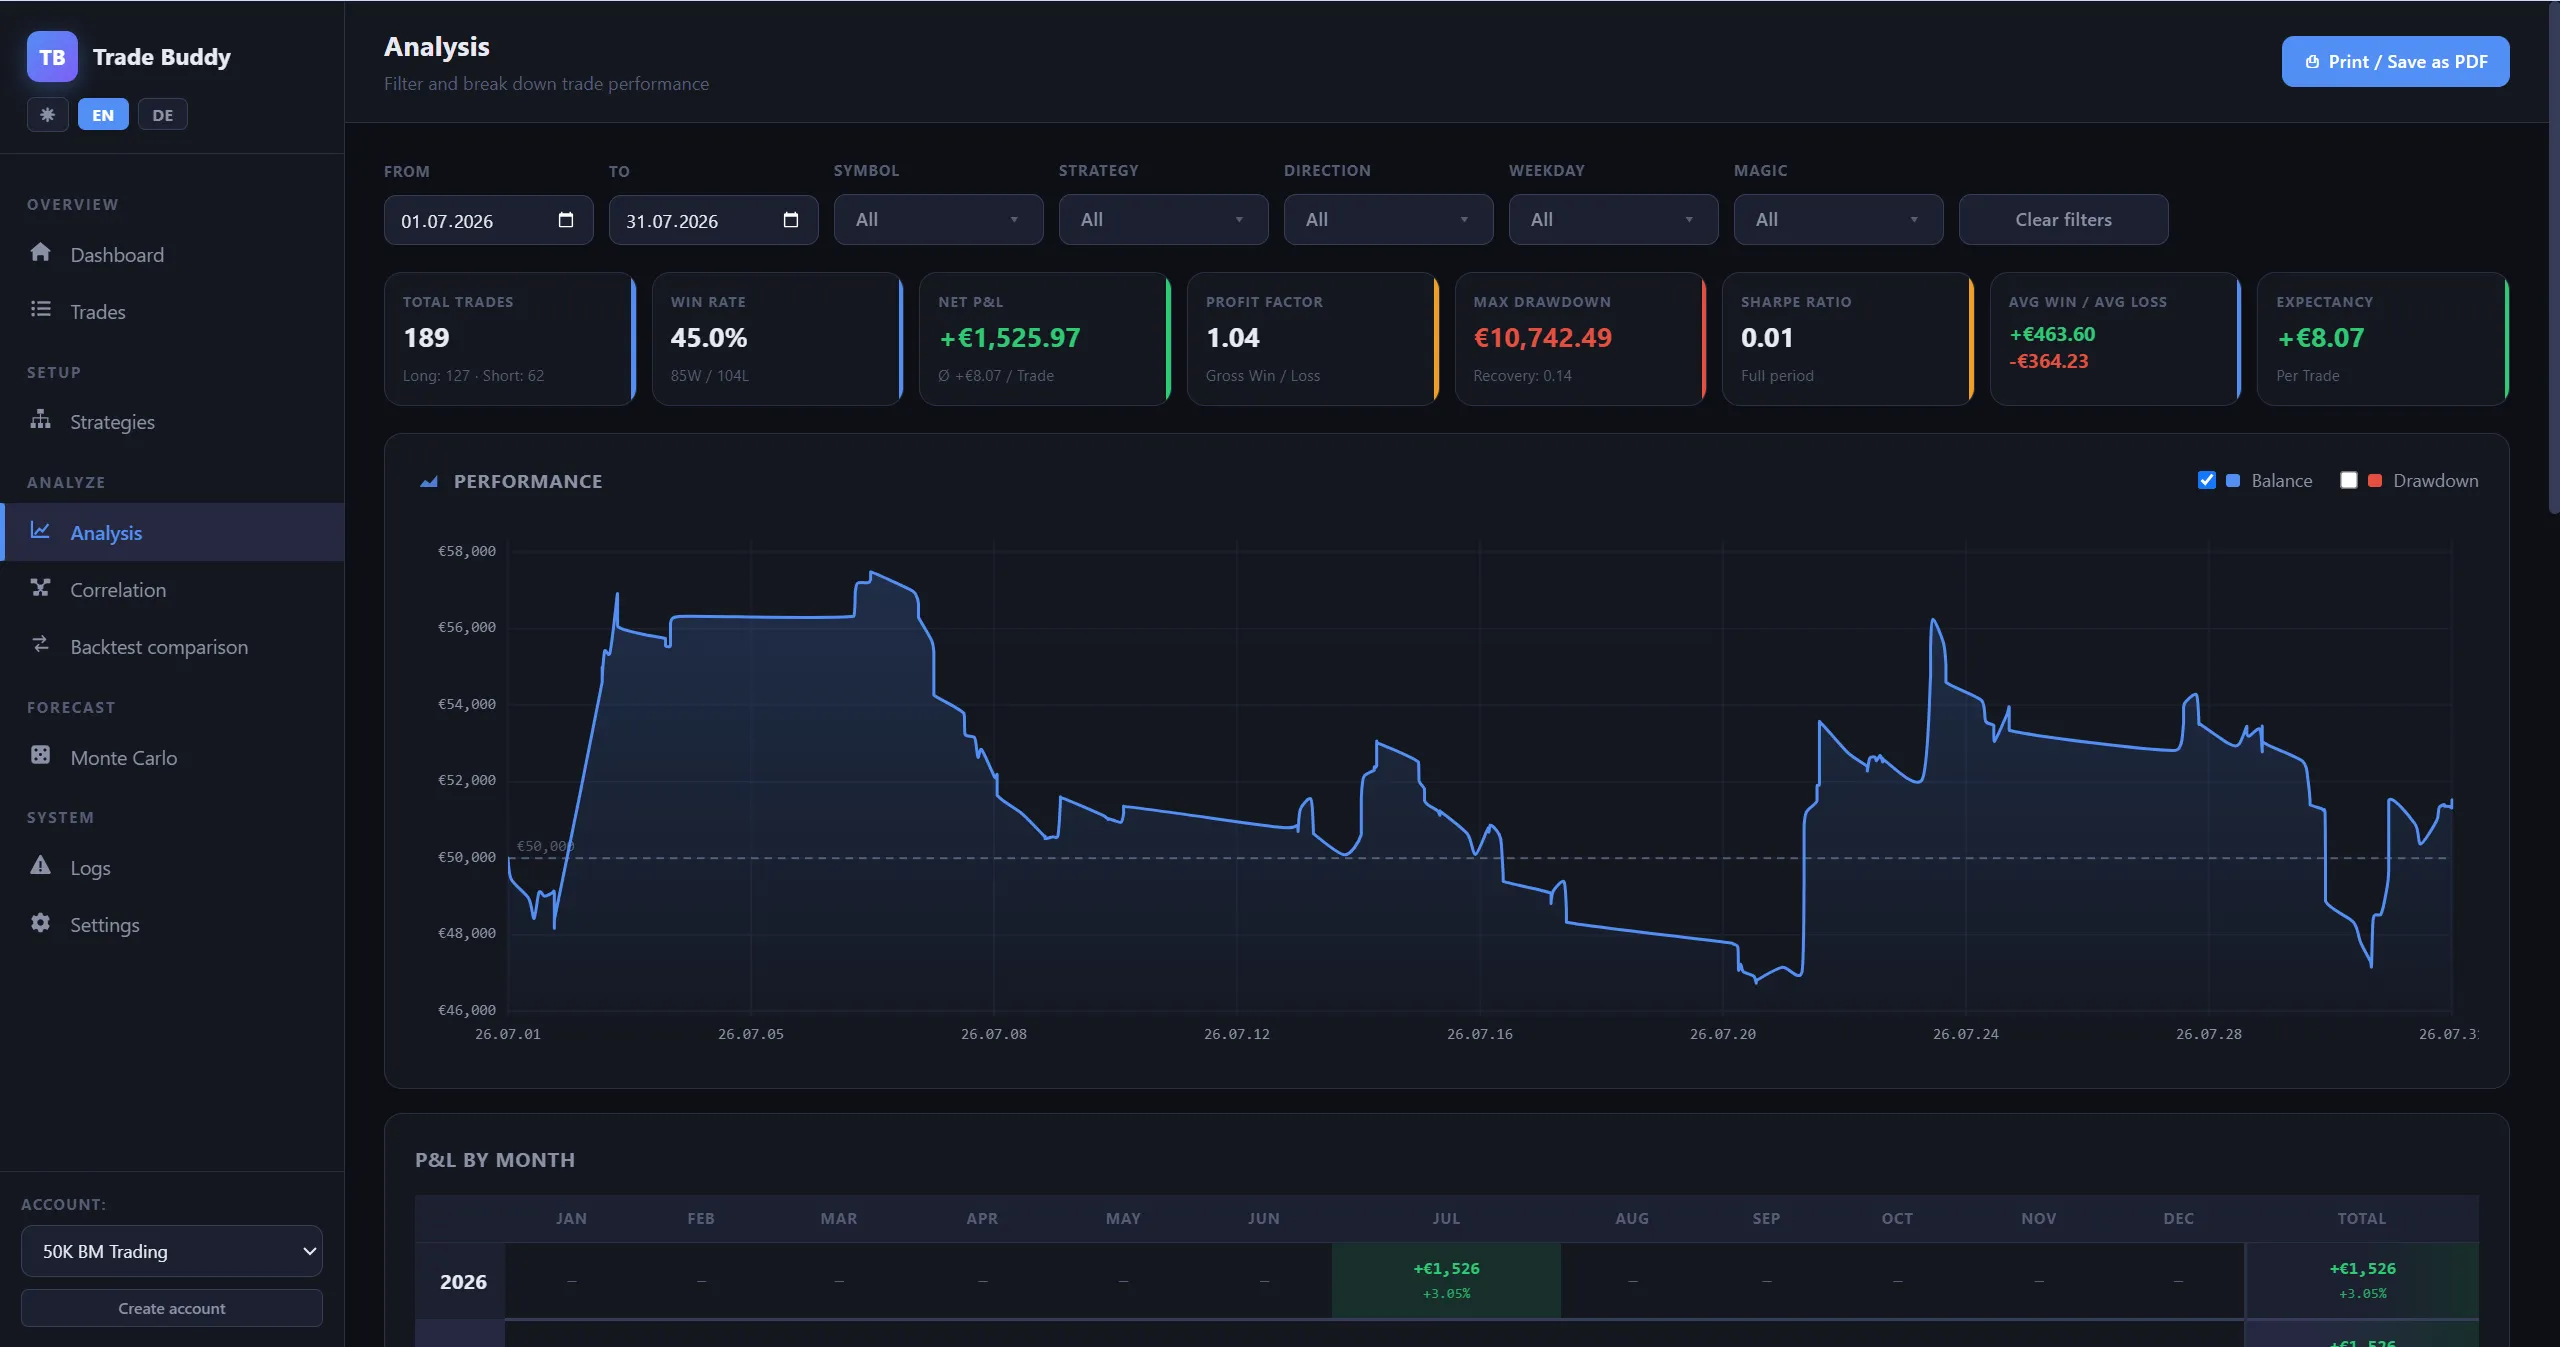
July 2026 — by market and strategy
| Market | Strategy | July 2026 |
|---|---|---|
| XAUUSD (Gold) | Range Breakout EA | −€227.38 |
| XAUUSD (Gold) | ATR Candle Breakout (experimental) | −€297.72 |
| EURJPY | Range Breakout EA | −€2,522.69 |
| USTEC | Go Long EA | −€3,730.21 |
| USTEC | Turnaround Tuesday | −€467.03 |
| US30 | Go Long EA | +€54.38 |
| US30 | Turnaround Tuesday | +€272.69 |
| US30 | Range Breakout EA | −€663.12 |
| DE40 | Go Long EA | +€1,525.98 |
| DE40 | Turnaround Tuesday | +€460.83 |
| DE40 | Range Breakout EA | +€92.79 |
| GBPUSD | Range Breakout EA | +€1,799.64 |
| USDJPY | Range Breakout EA | +€5,227.81 |
| Total | +€1,525.97 |
The wins
USDJPY — the redemption arc
+€5,228 with a 22% win rate. Read that again, because it’s the whole philosophy of the Range Breakout EA in one line.
Out of 22 USDJPY trades in July, only about five were winners. But look at the sizes: +€6,251 (my biggest trade ever — full breakdown here), +€2,738 and +€2,319, against a long list of small, controlled losses. That asymmetry — tiny stops, uncapped winners — is exactly why I don’t use a fixed take-profit and never close these trades manually.
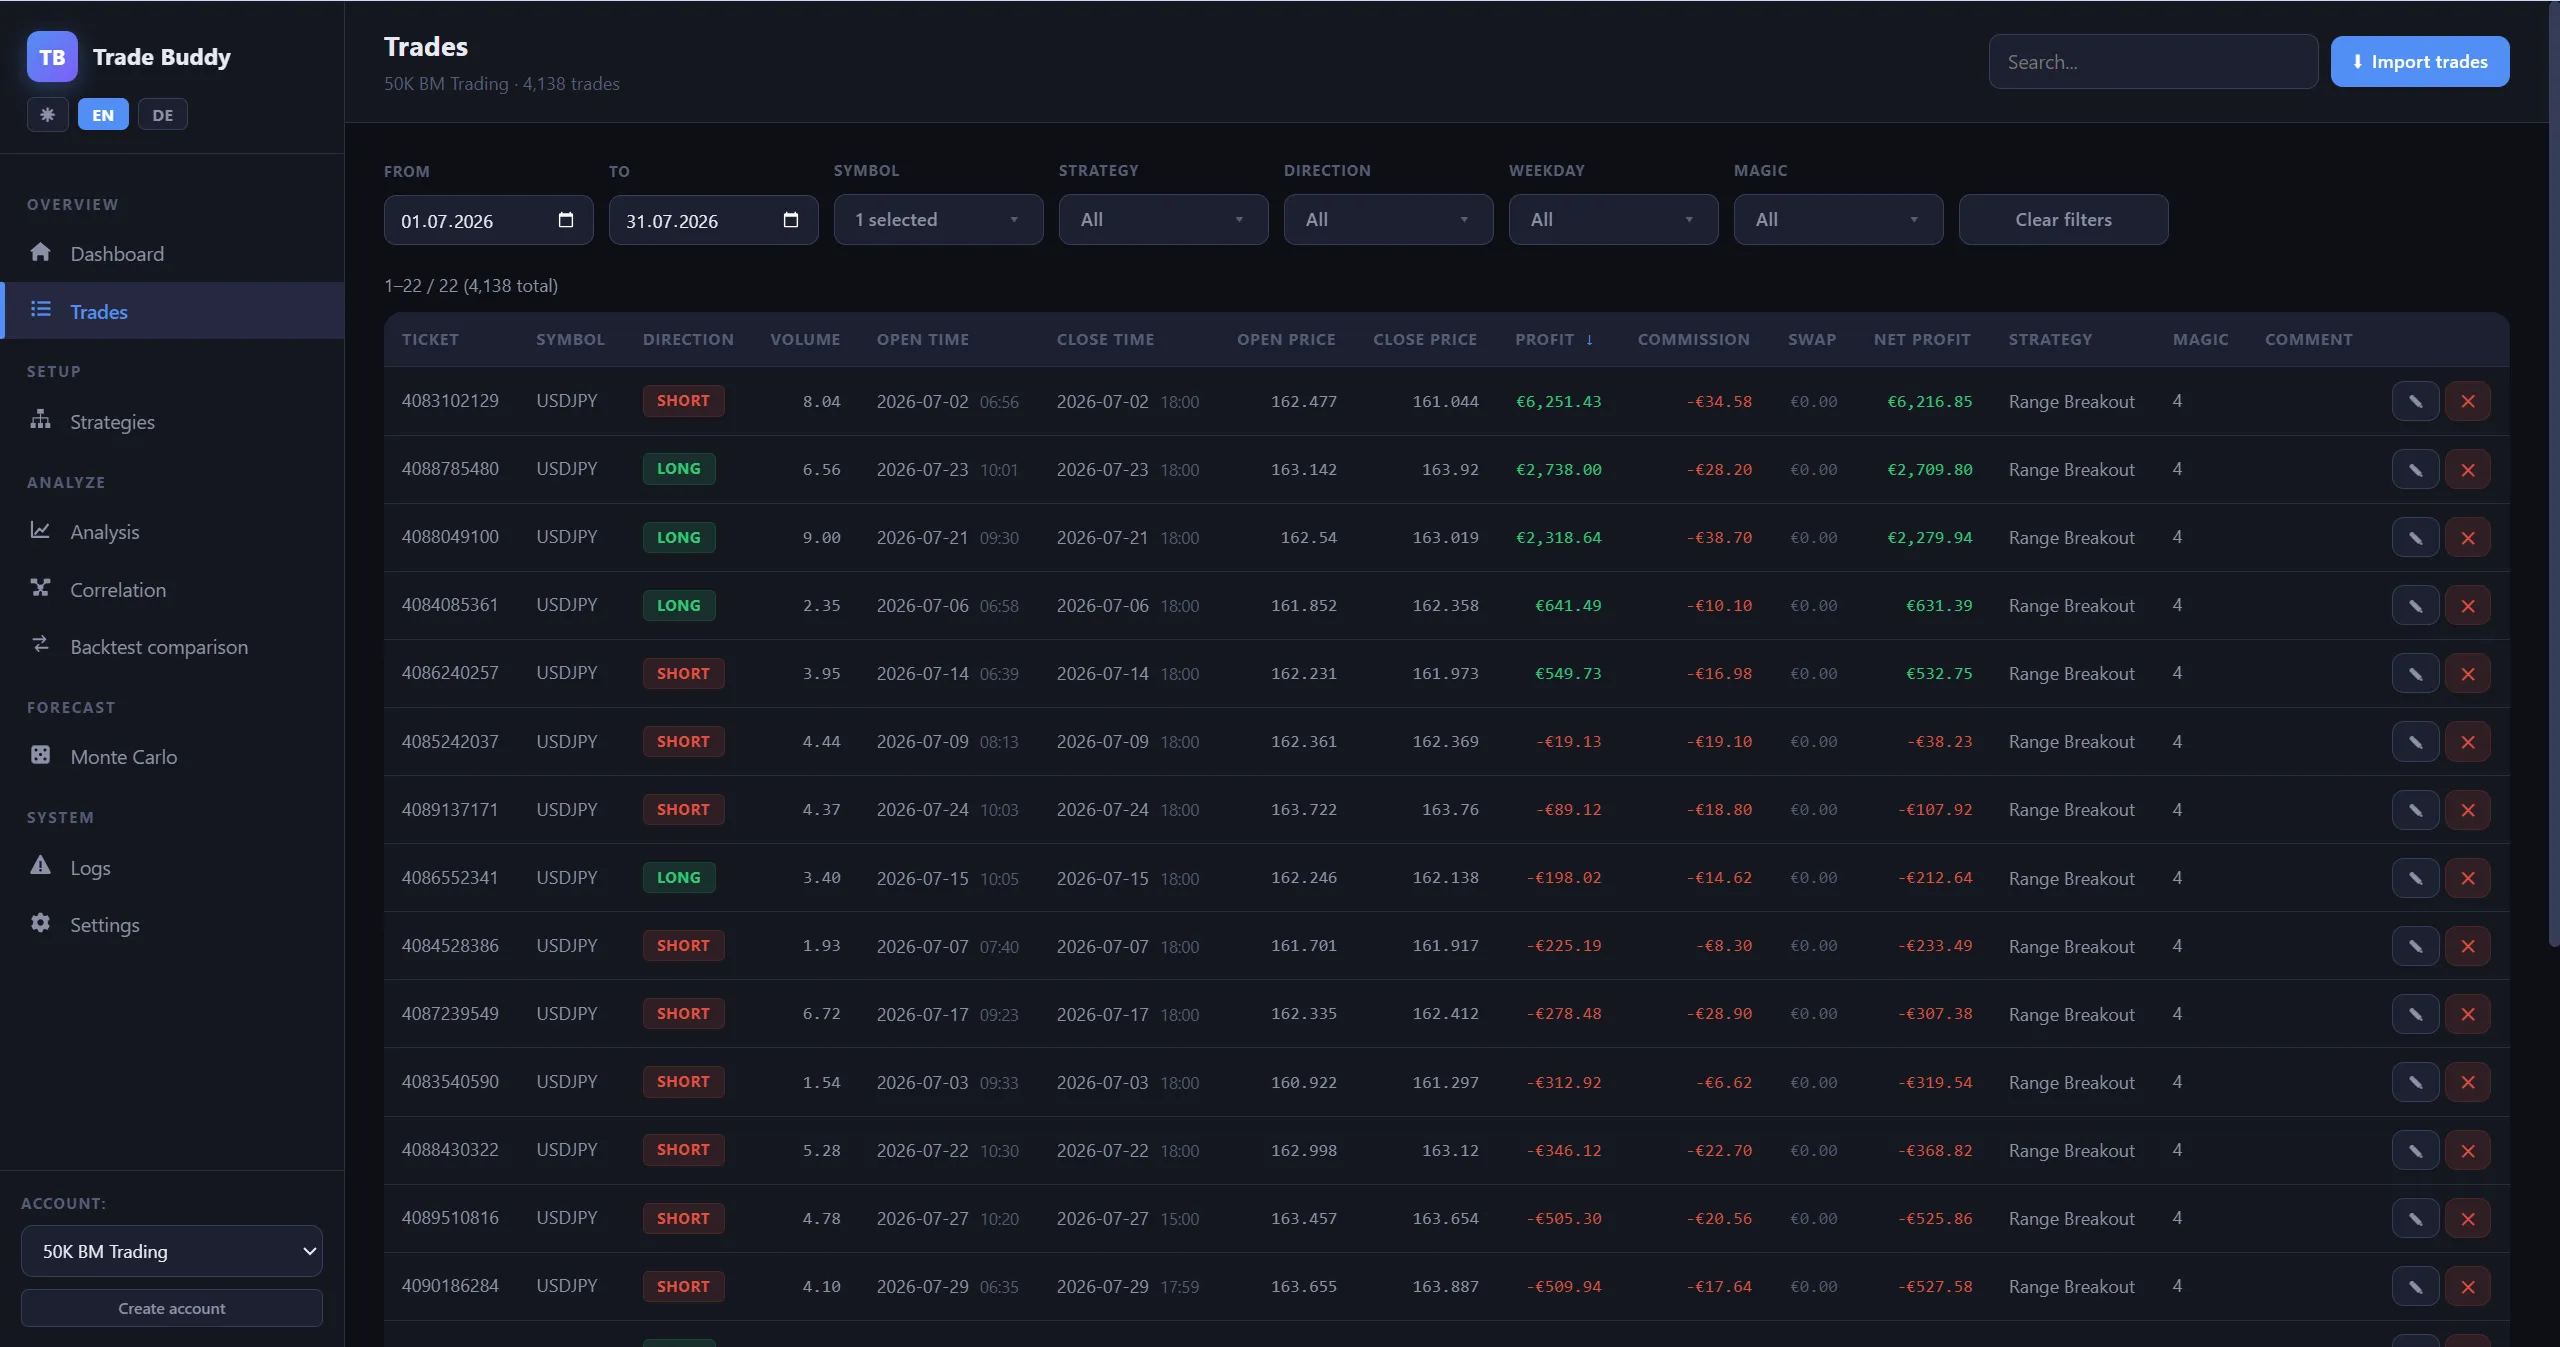
The bigger picture: USDJPY’s record drawdown bottomed at the very start of July, and this was the strategy’s best month in a long time. The extreme, whipsaw-style spikes that were killing it seem to be calming down. I’ll stay cautious — one month doesn’t fix a €23,000 drawdown — but the recovery has visibly started.
Full transparency though: a few days ago there was another monster move in USDJPY — and this account didn’t catch it (a second account I trade did). Breakout trading giveth and taketh; some days you’re simply not positioned.
GBPUSD — four green months in a row
+€1,800 in July — the fourth profitable month in a row. This pair was my longest-running disappointment: roughly a year and a half of steady bleeding, all-time still at −€4,593 with a profit factor of 0.91 over 504 trades. But the drawdown (worst point: −€11,901) is now about halfway recovered, and the turn in the equity curve is impossible to miss.
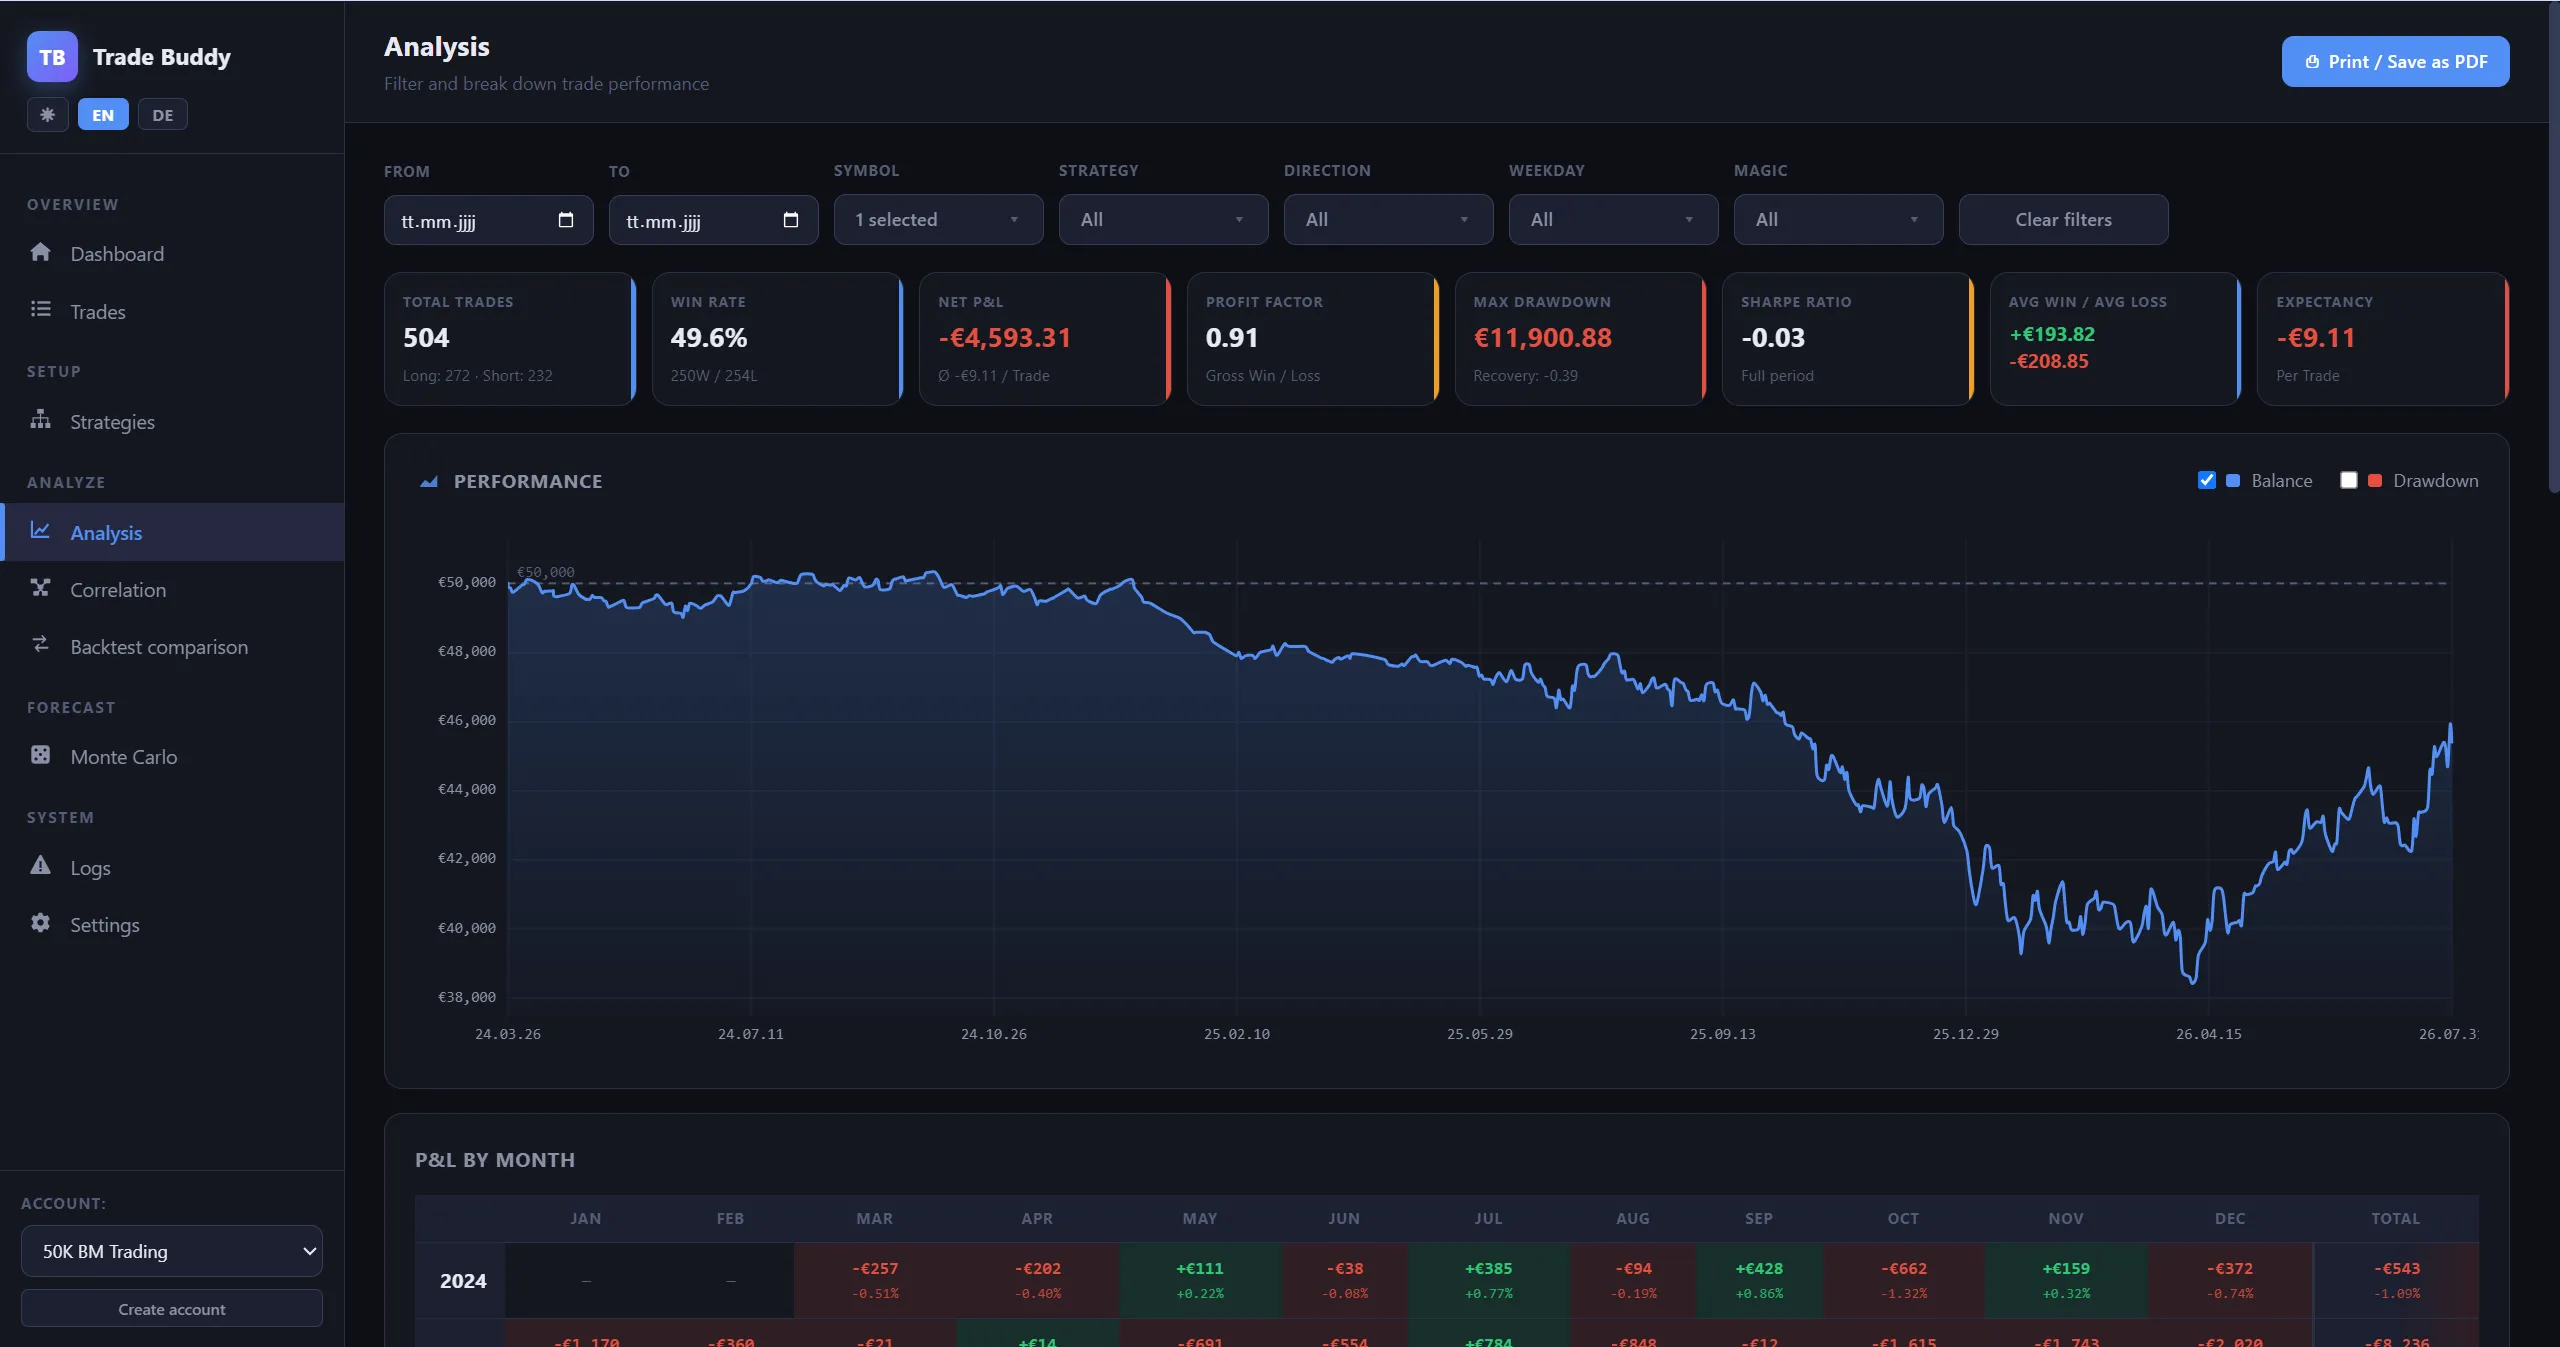
I said it about EURJPY last month and it applies here too: strategies can look broken for a long time and then quietly come back. Maybe this is the comeback GBPUSD needed.
DE40 — all three strategies green
The German index sits at its all-time high, and all three strategies on it were profitable: Go Long +€1,526, Turnaround Tuesday +€461, Range Breakout +€93 — about +€2,080 combined. Fun detail: Go Long on DE40 alone made almost exactly the entire month’s net result.
The honest part — USTEC and EURJPY
USTEC cost −€4,197 (Go Long −€3,730, Turnaround Tuesday −€467). After a ~30% surge in a few months, the index retraced to 5–7% below its high — and since my index strategies are long-only, they inevitably correlate with the market. When the index pulls back, they lose. That’s not a flaw to fix; it’s the deal I signed up for. The same correlation that produced the huge index profits of the past two years occasionally sends a bill.
US30 netted −€336 — Go Long and Turnaround Tuesday slightly green, but the Range Breakout EA lost −€663 with a genuinely bad win rate, despite risking only around €125 per trade there. Not dramatic, just weak.
EURJPY gave back −€2,523 at a 30% win rate — a chunk of the strong months that came before. All-time it’s back near break-even after roughly 200 trades. I’ve traded this pair for less than a year, so the honest statement is: the sample is still too small to judge it either way.
Gold — the quiet pillar (even in a red month)
Gold was slightly red in July: −€525 combined (Range Breakout −€227, ATR Candle Breakout −€298). Even the most reliable line in the portfolio has red months.
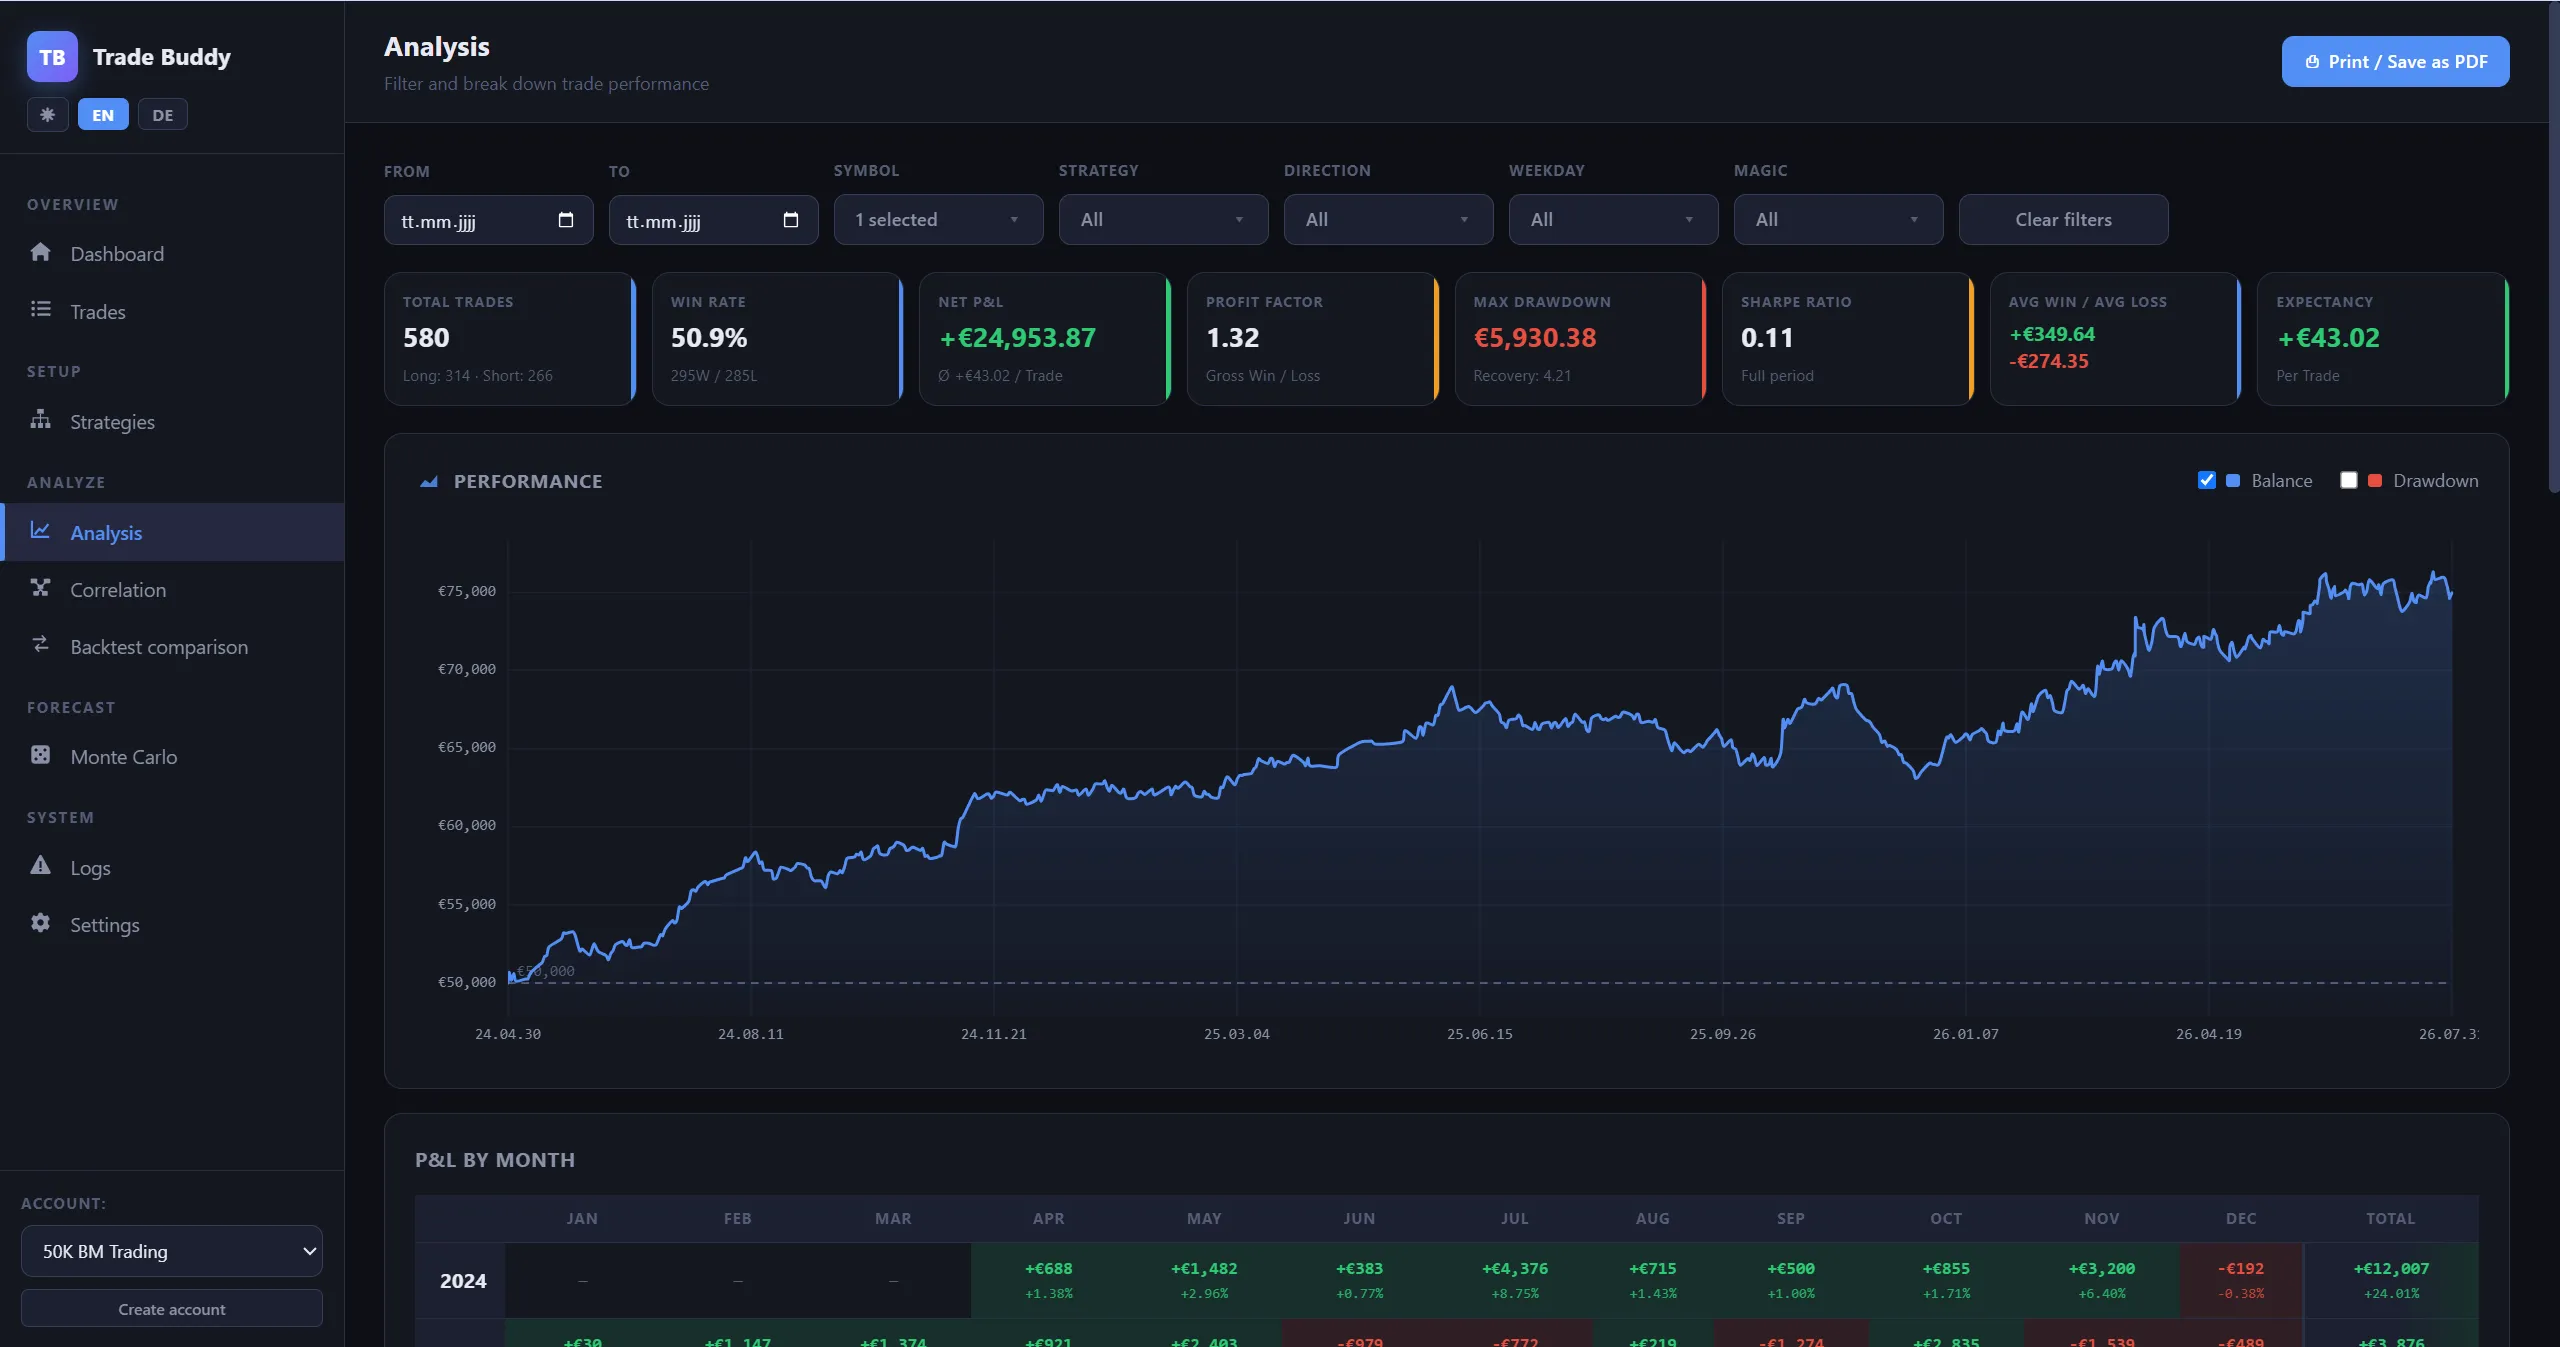
Zoom out, though, and it’s not close: +€24,954 all-time at a profit factor of 1.32, a win rate above 50%, and a maximum drawdown of only €5,930 — by far the most stable thing I trade. If someone asked me which single market has earned its place in this portfolio beyond any doubt, the answer is gold.
The big picture — €100k in sight
Through the end of July, the account stands at +€92,130 net across 4,138 trades, at a profit factor of 1.16. The Myfxbook screenshot at the top shows €93,478 verified because it already includes the first trading days of August — same transparency note as every month: I can’t cleanly cut the screenshots at month-end.
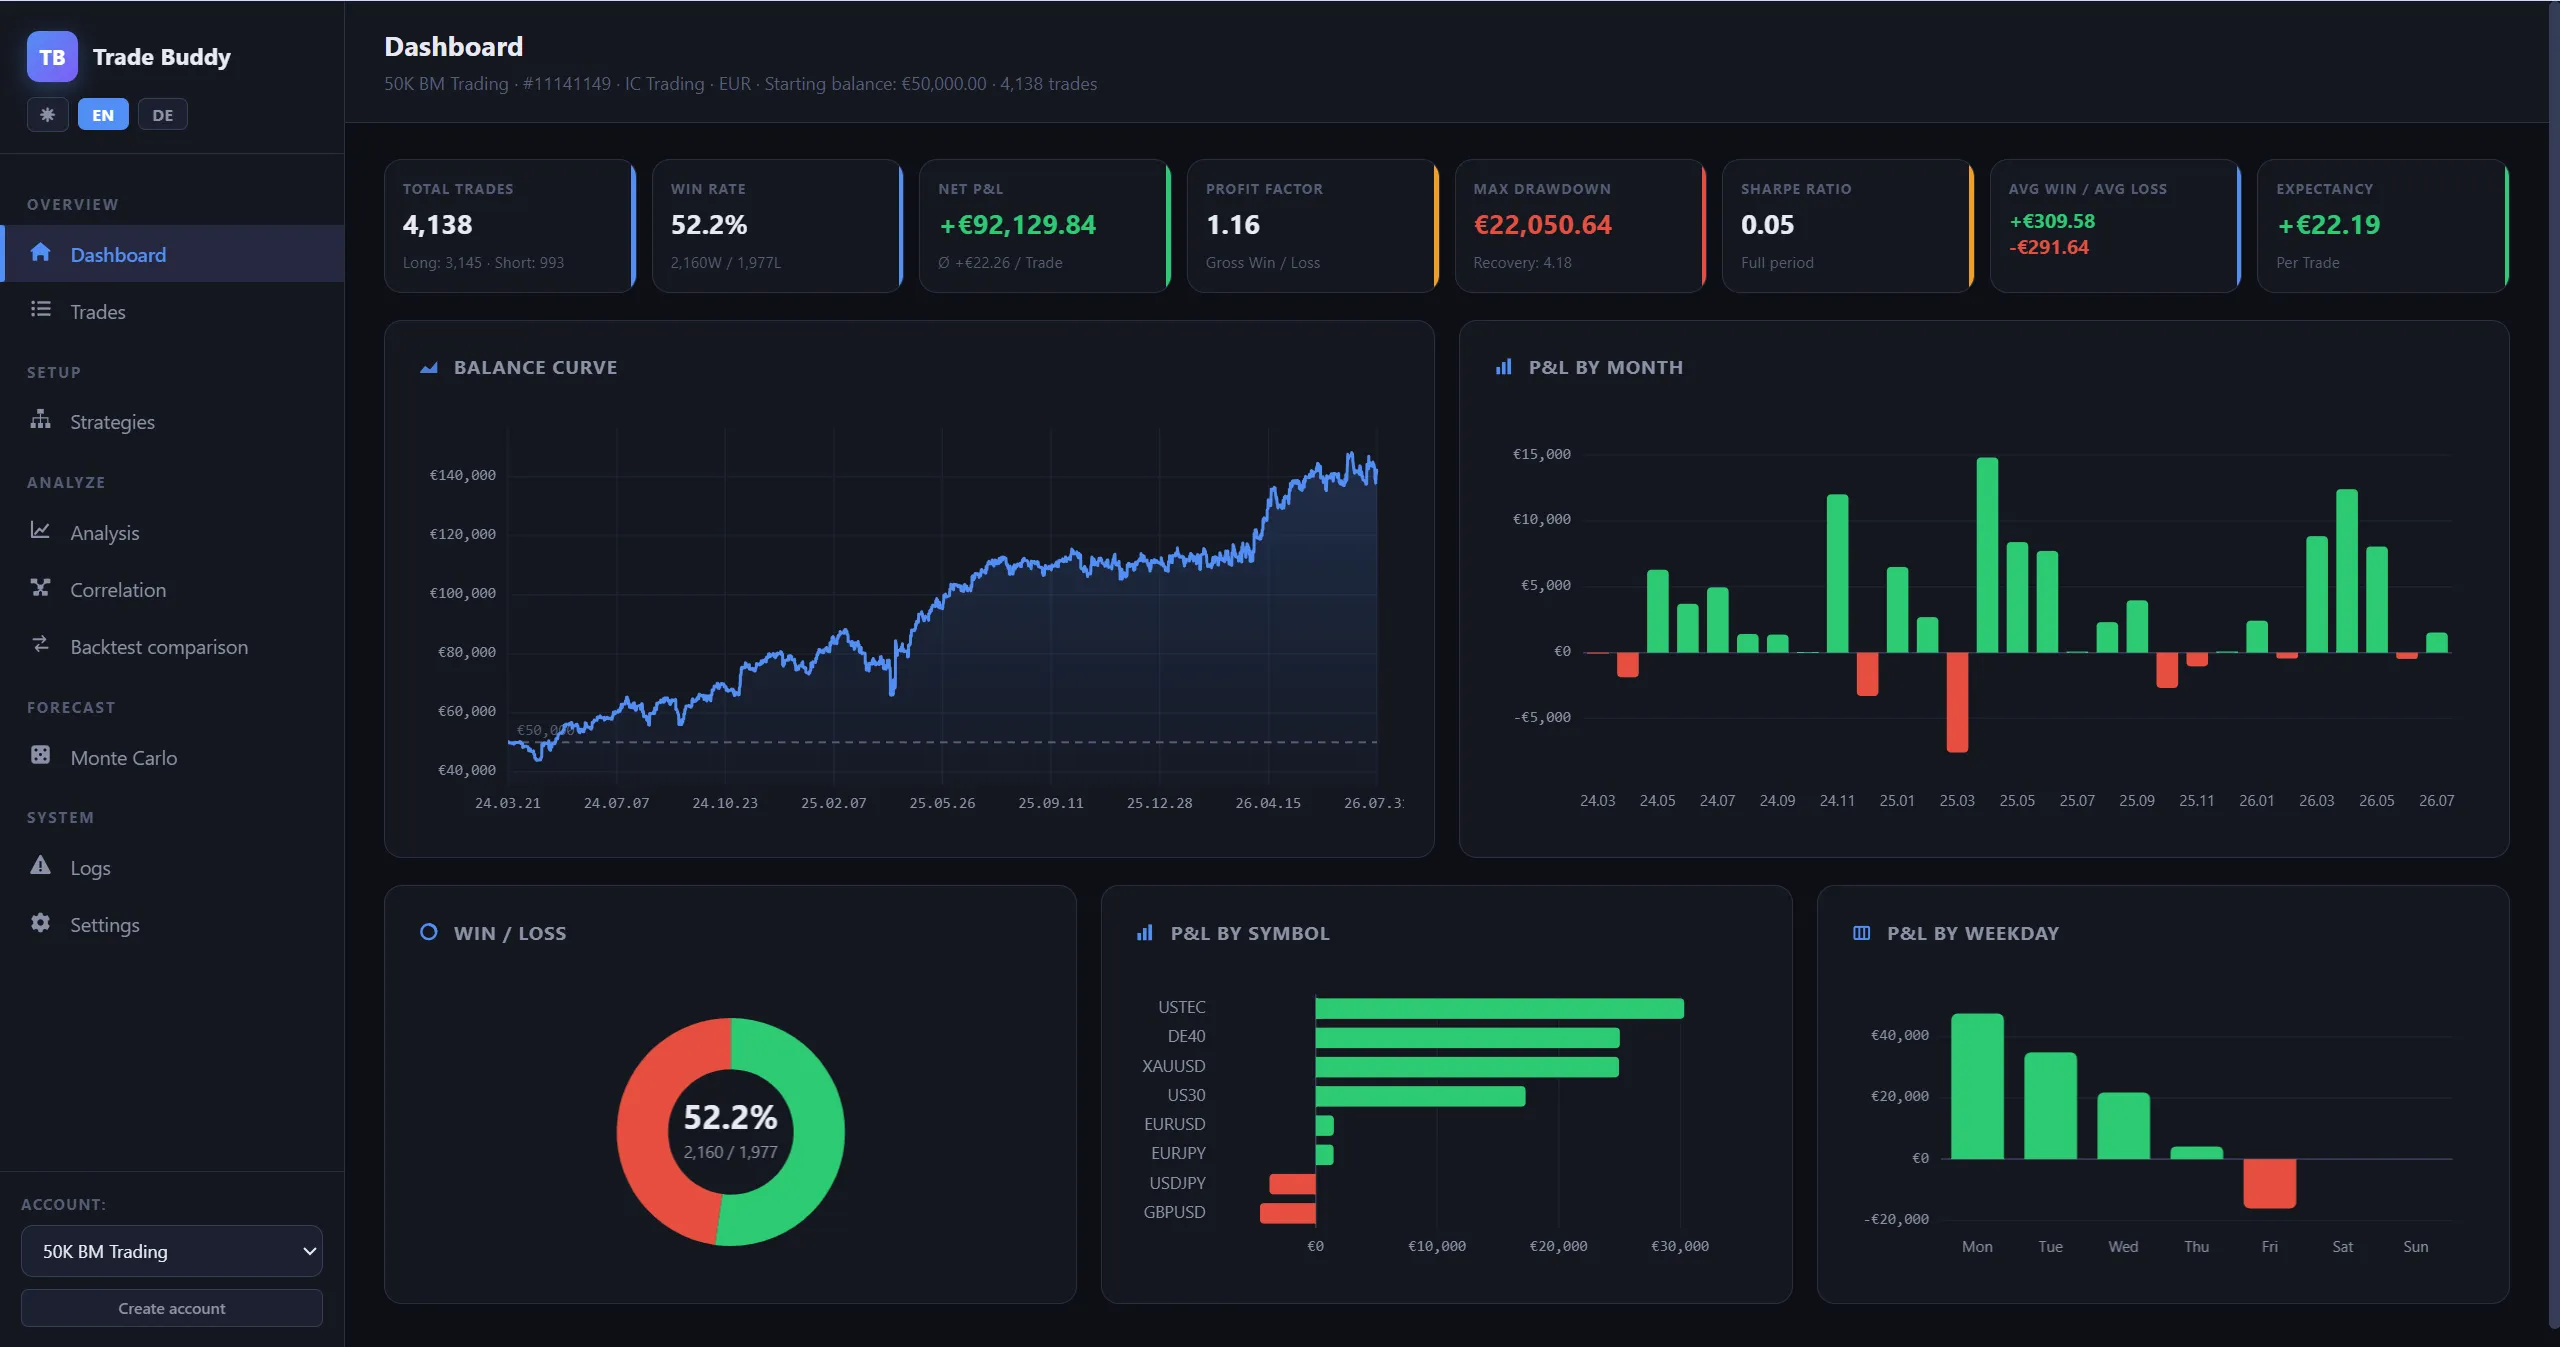
2026 is at roughly +€32,000 through July — my best year so far. If you extrapolated that to December you’d land near +€50k for the year, and I want to be crystal clear: that is not how trading works. The same leverage that built this can hand a chunk of it back, as USTEC just politely demonstrated.
But there’s one number I’m now openly watching: the account is about €6,500 away from €100,000 in verified profit. Peak was around €96–97k; we’re roughly €5k below it. No prediction, no timeline — but when that line gets crossed, you’ll read about it here first.
The EAs I run — all free
Every strategy above is free to download. Test them as long as you want in the MT5 Strategy Tester, then decide if you want to take them live.
To run them live, open an account with one of my partner brokers and submit your MT5 account number through the license form. That’s my business model, and it costs you nothing extra.
Next update
The August recap comes at the start of September — with the €100k watch officially on. Until then: good trading, and let your winners run. July was another reminder of why.
Risk note: nothing in this post is investment advice. Trading forex and CFDs carries significant risk. Past performance is no guarantee of future results.